by Mia Ilavska
October 6, 2026
Parking Data and Analytics, Explained: What Your Spaces Know
Parking data is the record of how every space is used: occupancy, turnover, dwell time and peak demand. What the four numbers mean, how sensors capture them, and how cities turn them into pricing, enforcement and planning.
Table of content
The four numbers that matter
Most useful parking decisions come from four metrics.
- Occupancy. The share of spaces filled at a given time. The headline number, and the basis for guidance and availability.
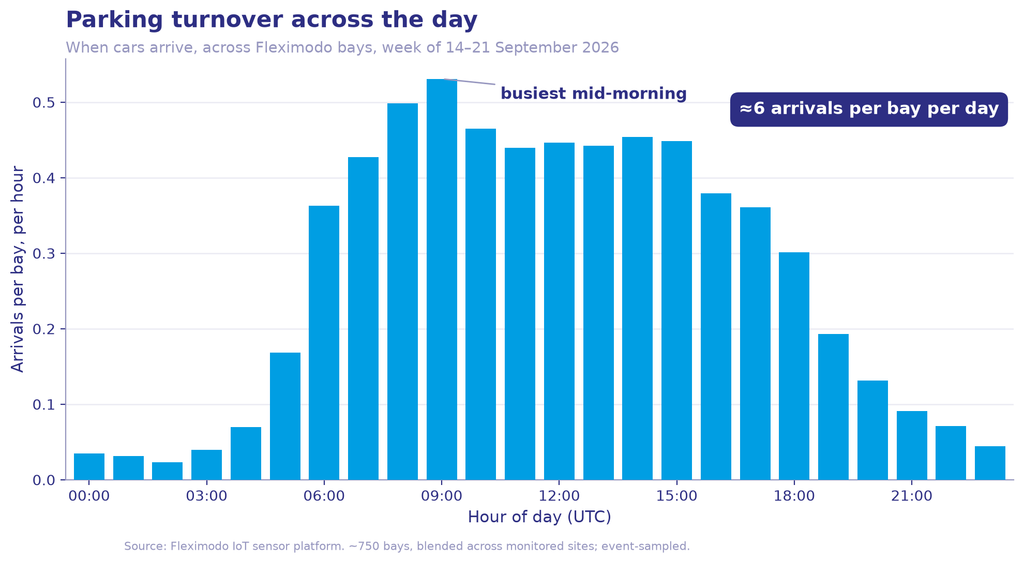
- Turnover. How many different vehicles use a space per day. High turnover means a space is working; low turnover can signal abuse or mispricing.
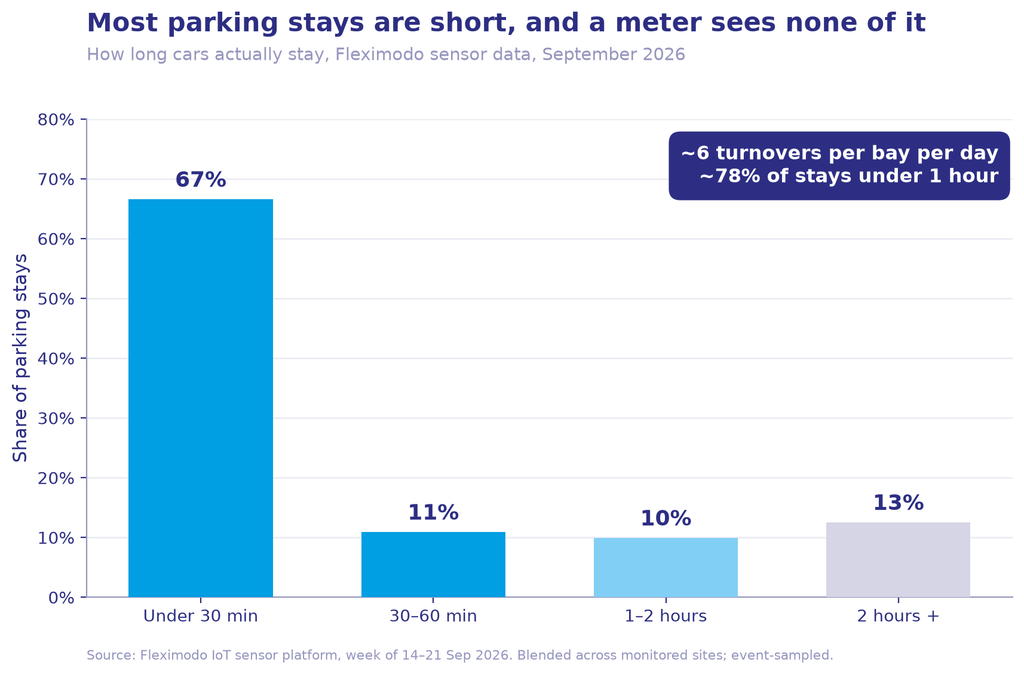
- Dwell time. How long vehicles stay. Long dwell in short-stay zones points to enforcement or pricing problems.
- Peak demand. When and where occupancy hits its limits. The input for dynamic pricing and capacity planning.
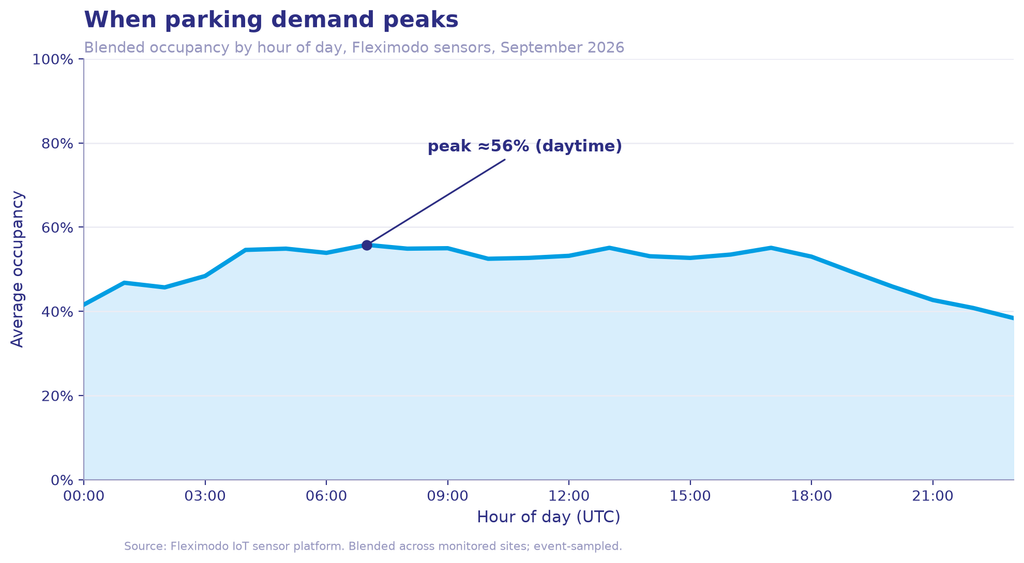
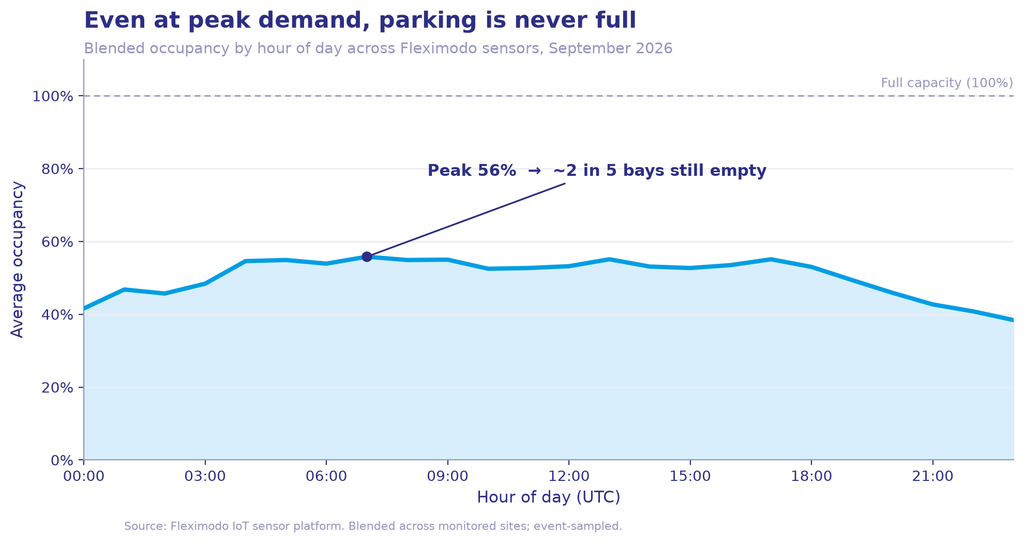
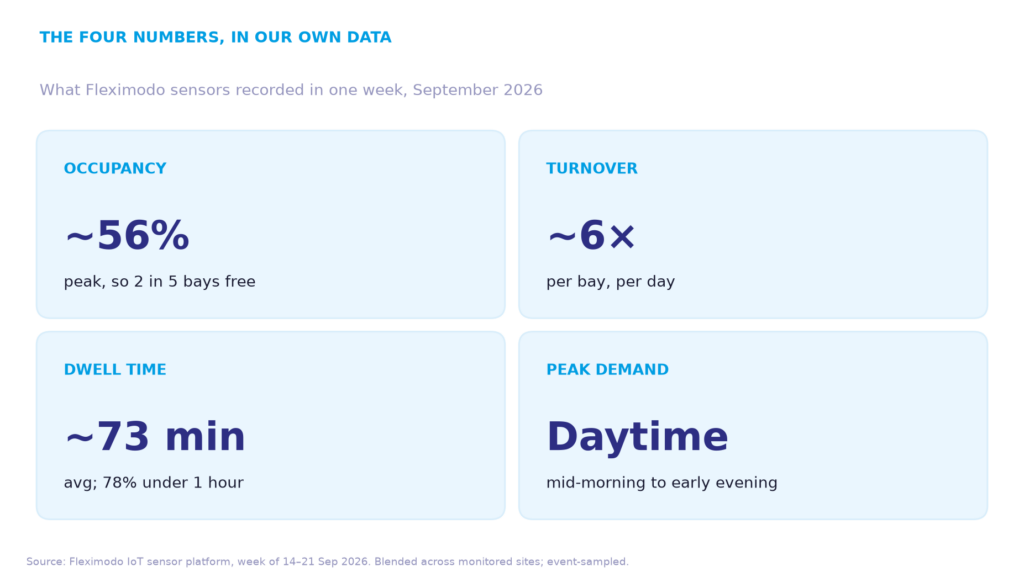
Here is what those four numbers look like in our own network. Across the Fleximodo bays reporting in one week of September 2026, occupancy peaked at about 56 percent even in the busiest daytime hours, so roughly two in five bays were free at peak. Each space turned over about six times a day. The average stay lasted a little over an hour, with nearly four in five under an hour. And demand concentrated in the daytime, from mid-morning to early evening. None of that is visible without sensors, and all of it changes what a city should price, enforce or build.
How parking data is collected
The data starts at the space. A parking sensor records each arrival and departure with a timestamp, at 99.96 percent accuracy, and sends it over a low-power network. A platform like CityPortal aggregates every space into live maps, historical charts, and alerts, and exposes it through an API so it can feed apps, signage, and city systems. Because detection is magnetic, the data is about vehicles and spaces, not people, which keeps it GDPR-friendly.
For how that detection works, see how parking sensors work.
What cities and operators do with it
Parking data answers the questions that used to be settled by opinion. Should this street get dynamic pricing? Occupancy and peak data say whether it is actually full. Is the permit scheme respected? Turnover and dwell data show it. Do we need to build more parking? Utilization data usually reveals the existing supply is not full, just badly distributed, which can defer construction that costs €20,000 to €50,000 per space.
Enforcement gets sharper too. The same data flags where non-compliance clusters, so officers go where the problem is. See parking compliance and parking data ROI.
FAQ
What is parking data?
Parking data is the record of how parking spaces are used: occupancy, turnover, dwell time, and peak demand, captured per space by IoT sensors. It turns assumptions about parking into measured facts a city or operator can act on.
What can you do with parking analytics?
Parking analytics supports pricing decisions, capacity planning, enforcement targeting, and permit management. It reveals whether a zone is genuinely full, whether spaces turn over, and where non-compliance clusters, so decisions rest on evidence instead of complaints.
How is parking data collected?
In-ground IoT sensors record each vehicle arrival and departure with a timestamp and send it over a low-power network to a platform. The platform aggregates it into live maps, historical statistics, and an API. Fleximodo sensors do this at 99.96 percent accuracy.
Is parking data GDPR-compliant?
Yes. Sensor-based parking data records the presence and timing of a vehicle in a space, not a person or a plate, so it processes no personal data. That makes it inherently privacy-friendly compared with camera-based collection.
Can parking data reduce the need to build parking?
Often, yes. Utilization data frequently shows existing supply is not full but poorly distributed. Since one underground space costs €20,000 to €50,000 to build, using data to defer construction is usually the largest financial return from a deployment.
