by Mia Ilavska
October 22, 2026
How to Use Parking Data: A Guide for Cities, Operators and Property Owners
See what real parking data looks like hour by hour, and how cities, parking operators, retailers and fleets turn the daily demand curve into revenue.
Table of content
Key takeaways
- A daily average hides demand that swings up to 40 times between night and midday.
- Even at its busiest hour, the zone we measured was only about half full. Occupancy never topped ~52 percent all week.
- Payment records and manual counts give you totals. Per-bay sensor data gives you the shape of the day.
- Fleximodo runs more than 71,000 sensors across 50+ countries at 99.96 percent detection accuracy.
The daily average is the problem
The most common parking metric, average occupancy, is the least useful one for decisions. It describes an hour that barely exists.
Here is one on-street zone in Fleximodo’s network: 35 bays, seven days of live data in October 2026. Arrivals average about 31 cars an hour. Overnight the figure sits near 1. By late morning it reaches about 53. Same street, same bays, demand roughly 40 times higher before lunch than it was at 3am.
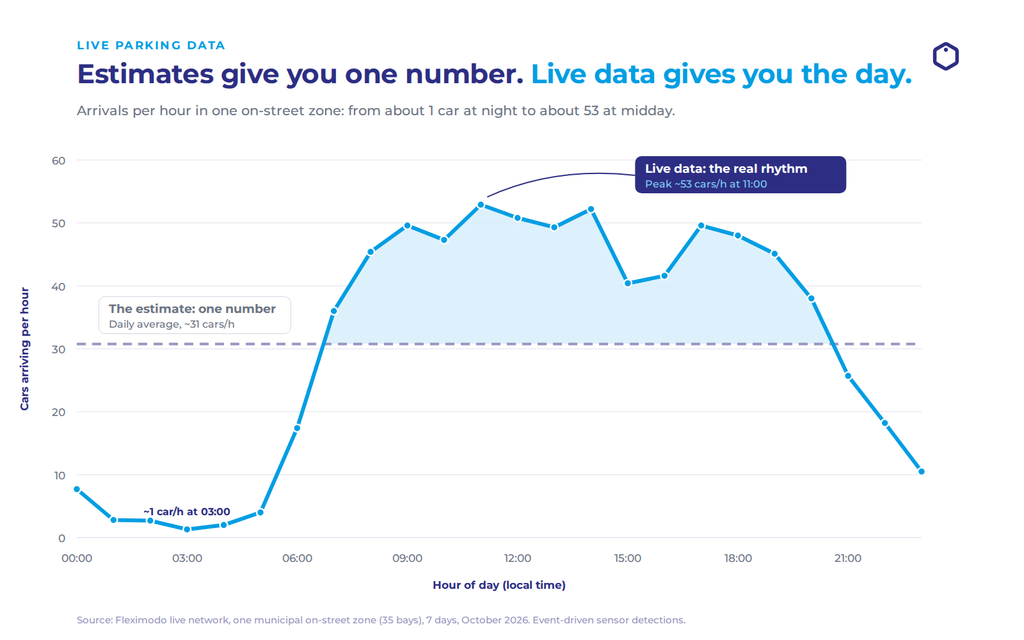
Everything built on the average inherits its blind spot: fixed tariffs, enforcement rounds on a set schedule, signage that reads the same at midnight and at noon. Each is tuned to one hour and wrong for most of the rest. The value is in the curve, and four kinds of owner can act on it.
There is a second number the average hides. In that same week, even at the 11am peak, only about half the bays were taken, and occupancy never rose above roughly 52 percent on any hour of any day. The street was never full. It was busy in bursts and empty the rest of the time, which is a different problem than a shortage, and a more valuable one.
How cities and curb managers use parking data
Price and police the curve, not the average, and measure it per block rather than per district.
When tariffs follow demand, the street charges more during the real midday peak and little or nothing when the bays sit empty. San Francisco’s SFpark set curb prices from sensor-measured demand and aimed for one open space on every block. You cannot manage to that target with a district-wide average, only with a per-bay record.
The economics are blunt. A single structured parking space costs roughly 20,000 to 50,000 euro to build, and underground parking adds an estimated 10 to 25 percent to the cost of a home above it. A city that can show its bays sit half-empty at peak has a cheaper answer than building more: price and reallocate the ones it already has. Bays occupied two hours out of twenty-four can become loading zones, bike lanes, greenery or housing.
Enforcement follows the same logic. Route officers to the busy windows, where mature compliance runs near 80 percent while a neglected street drops to 30 or 40 percent and leaks revenue every day. This is the quiet case for smart parking: using the space you have instead of pouring more concrete.
How parking lot and garage operators use parking data
A single price all day is the most expensive habit in parking, and dwell time is the metric that fixes it.
Occupancy tells you how full you are. The dwell-time distribution tells you what you are actually selling. If most of your stays are short, an hourly tariff underprices your real product, and a 15 or 30-minute increment captures the turnover you already have. The extra revenue that makes one bay pay like two comes from turnover, not from a higher sticker price.
Your weekday and your weekend are two different businesses. In the zone we measured, the weekday curve spiked with a mid-morning commuter rush, while the weekend built slowly and peaked after lunch about 15 percent lower. One pricing calendar for both underprices the busy day and empties the quiet one.
Parking data also settles arguments. A pricing case backed by twelve months of real arrivals, not a hunch, is what justifies an expansion, defends a lease rate, or tells you to walk away from one.
How retail and commercial property owners use parking data
Your car park is the cleanest first-party dataset you have on your customers, and most owners book it as a cost line.
Arrivals are a footfall proxy you already own, so match them to the hours you pay for. If cars build after 11am and clear by 7pm, a tenant trading until 9 is paying rent for hours with no traffic, and that belongs in the next lease conversation. Dwell time sorts the rest: short stays mean grab-and-go, long stays mean destination, and the mix decides whether you price for turnover or for the visit.
The empty bays are an asset, not a loss. In our measured zone the lot was never more than about half full, which for a retail owner is space that can earn as click-and-collect, EV charging, or last-mile logistics instead of sitting as striped asphalt.
How fleets use parking data
Fleets lose time to the search, not the space, and the search is expensive. Across 16 studies of congested districts reviewed by Donald Shoup, about 30 percent of traffic on average was drivers hunting for a space.
A loading bay that is free at 2pm and gridlocked at 5pm is a schedule, not a guess. Dispatchers who plan stops around the curb’s real free windows cut that cruising directly. The same per-bay data that prices a street for a city tells a logistics operator which block to avoid at rush hour.
What separates usable parking data from noise
Parking data is only actionable when it is per-bay, real-time and accurate.
For a deeper look at the metrics themselves, see parking data and analytics, explained. Aggregate counts and once-a-month surveys produce the average that caused the problem. A per-bay sensor records each arrival and departure as it happens, which is what builds the curve. Accuracy decides whether you can trust a pricing or enforcement decision to it: Fleximodo’s sensors detect at 99.96 percent accuracy and run for about ten years on a single battery, so the record stays complete without constant maintenance.
Frequently asked questions
What is parking data?
Parking data is the record of how parking spaces are used over time: arrivals, departures, occupancy, dwell time and turnover, ideally measured per bay rather than as a lot-wide total.
Why isn’t average occupancy enough?
An average flattens the day into one number. Real demand can swing more than 40 times between the overnight low and the midday peak, so decisions made on the average are wrong for most hours.
How can parking data increase revenue?
It supports demand-based pricing, better-targeted enforcement, staffing matched to real arrivals, and reservations sold into peak windows. For cities, it also recovers compliance revenue that flat enforcement leaves on the street.
What is the difference between payment data and sensor data?
Payment data tells you who paid and when. Sensor data tells you how every bay was used, including unpaid and overstaying vehicles, which is the full picture pricing and enforcement need.
The curve is already under your street
Demand is not flat anywhere, and the pattern is already there whether or not you measure it. We sell parking sensors, and we will still say it plainly: most cities have more parking than they can afford. The same per-bay data that prices a space also proves how often it sits empty, and reading that honestly is how one bay does the work of two.
Fleximodo is building parking’s data infrastructure across 50+ countries, turning streets and lots into a live record their owners can act on. The hard part is not collecting parking data. It is reading it. That is the part we help with.
See the full picture on our smart parking page, or talk to us about what your own curve looks like.
